
Who was most likely to survive when the Titanic crashed into that iceberg on its ill-fated maiden voyage? And who was least likely to survive?
Colorado Academy Senior Ben Freeman can answer those question confidently, and not because he has a hunch or is guessing. He knows the answers because he has studied the Titanic’s passenger log and dissected the data of who lived and who died by gender and age. He couches his answer in the context of Director James Cameron’s Titanic, which it turns out, was historically accurate.
“Rose would have been the most likely to survive, because when we looked at women in first class between the ages of 15 and 18, 100 percent survived,” Freeman says. “But males traveling in steerage were the least likely to survive—so that’s Jack in a nutshell.”
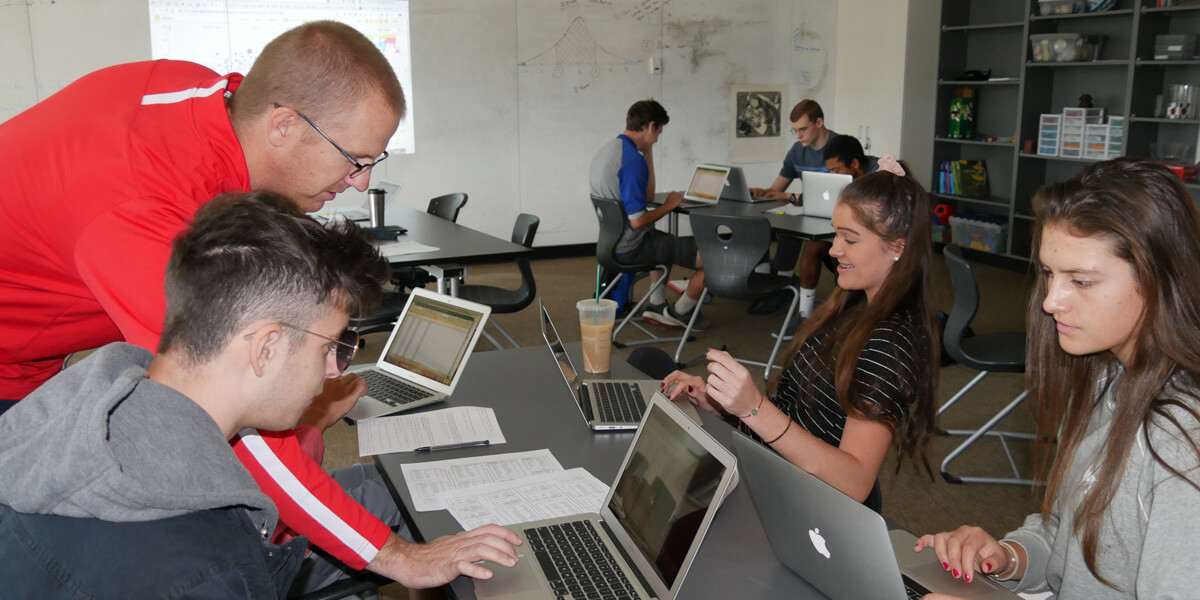
Freeman’s Titanic research was just one of the data study projects done by students in Austin Harvey’s Upper School course, “Business Intelligence, SQL, & Data Visualization.” The class takes students deep into a world of data, gives them the training and tools to ask the right questions, prepares them to analyze the answers, and helps them find the true story data tells in any context—business, science, accounting, human behavior, world events.
“You cannot spin data,” Harvey says. “Students should learn how to let the data speak for itself, because data can put truth into the world.”
‘Oh, my gosh, I got it!’
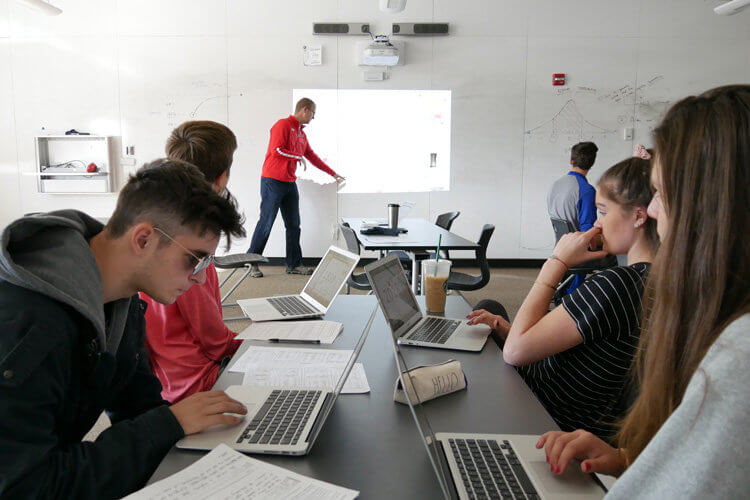
Visit Harvey’s class on a typical day and you will find students staring earnestly at their computers where there might be hundreds, or thousands, of rows of data. What might seem overwhelming is just another day’s challenge for students in this class. Using publicly available data sets, students analyze national park attendance, retail sales in Iowa, NFL player statistics, cats vs. dogs in different states, even movie data.
By the end of the course, students can move smoothly among three different data analysis tools: Excel, SQL (Standard Query Language), and Tableau. Harvey points out that students who know those three software tools have a high degree of job preparedness. He reminds students that someday in a job they may be asked, “How are sales in Colorado?” and being able to answer that question accurately will have real-world ramifications. But even more important to Harvey than career goals is the fundamental education in data his course provides. “Our world is inundated with data,” he says. “This course helps students become smart consumers of data and develop a sense of the right questions to ask and the right interpretation of the answers.”
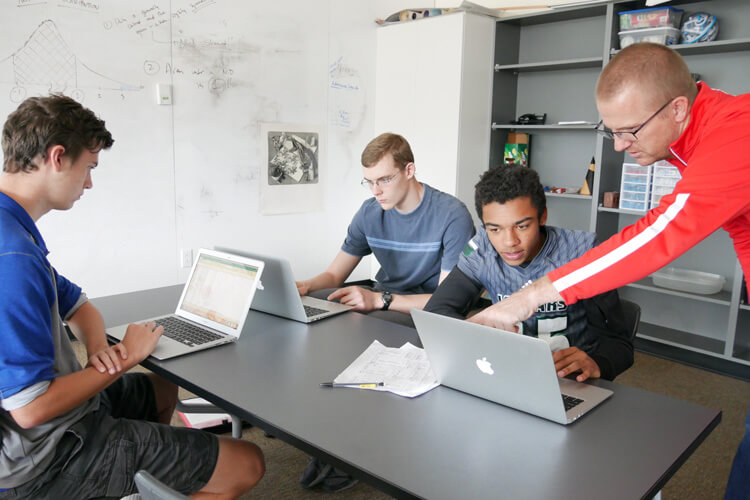
The path to the answers is not always without roadblocks. As students work in small groups in the class, there are plenty of furrowed brows as real-world and computational thinking collide. Harvey moves from group to group gently coaching students who may be stuck.
“That code may need an extra line.” “Add a filtering command.” “Drill down; you’re really close.”
Then you hear a student exclaim, “Oh my gosh, I got it!” and you can see frustration produce persistence and learning.
‘You can analyze data in any field’
Harvey emphasizes that this course is “exactly for students who have no experience coding.” That was good news for Junior Adeline De Leeuw.
“I thought I would never code, but now I understand coding, and that is very helpful,” De Leeuw says. “This course is a good fit for everyone, both beginning coders and students with experience.”
For her project, De Leeuw and her classmate Genevieve Howard analyzed popular baby names from 1915 through 2012 by state and looked at how name choices had changed. She discovered that during that period, popular girls’ names evolved so that no 1915 popular name remains today except one—Mary. In contrast, several boys’ names maintained their popularity through the years including “William” and “James.”
“The subject matter I was analyzing wasn’t really serious now, but it will be very serious in the future,” says De Leeuw, who plans to study nanobiotechnology in college with an eye on a career in business or economics. “As long as you have the tools, you can analyze data in any field.”
Freeman also sees the usefulness of this course for his future. “My other passion is science, where there is a good chance I will have large data sets to work through,” he says. “Now I can recognize what story the data will tell, finding the important trends in 12,000-plus data sets that I wouldn’t otherwise have been able to find.”
‘Deconstruct a simple idea’
In different hands, studying data might be dreary, but Harvey’s enthusiasm for the class is contagious. “It’s cool to see him get excited about seeing trends as he pulls data out of immense databases,” Freeman says.
Harvey discovered his passion for data in graduate school while he was also working a short-term job for the Colorado Department of Revenue analyzing retail data for every company in Colorado to help legislators see changes in retail sales by industry. In his next position, Harvey evolved into the in-house data analyst for a school where he was working. He presented school data at conferences—and discovered there was a hunger for the kind of information he could glean from pages of data.
Then it hit him. Wouldn’t the skills that he had learned serve students well? That produced the current course with its emphasis on computational thinking. It can be taken for credit in Mathematics or Computer Science, Engineering & Design.
“What students are learning is how to deconstruct a simple idea that appears complex on the surface but has a scaffolded, understandable structure to it,” Harvey says. “Data is the way students can acquire this skill.”